Property Replacement Map
An interactive map for modeling local property price changes according to building type replacement
Interactive Map Details
Click here to access the map. The source code for the map is available here.
This interactive map models how local property prices in Providence change in response to building replacement.
Instructions
- To see property boundaries more clearly, toggle 'Show Price Heat Map'. The price values come from a 2019 Providence property assessment.
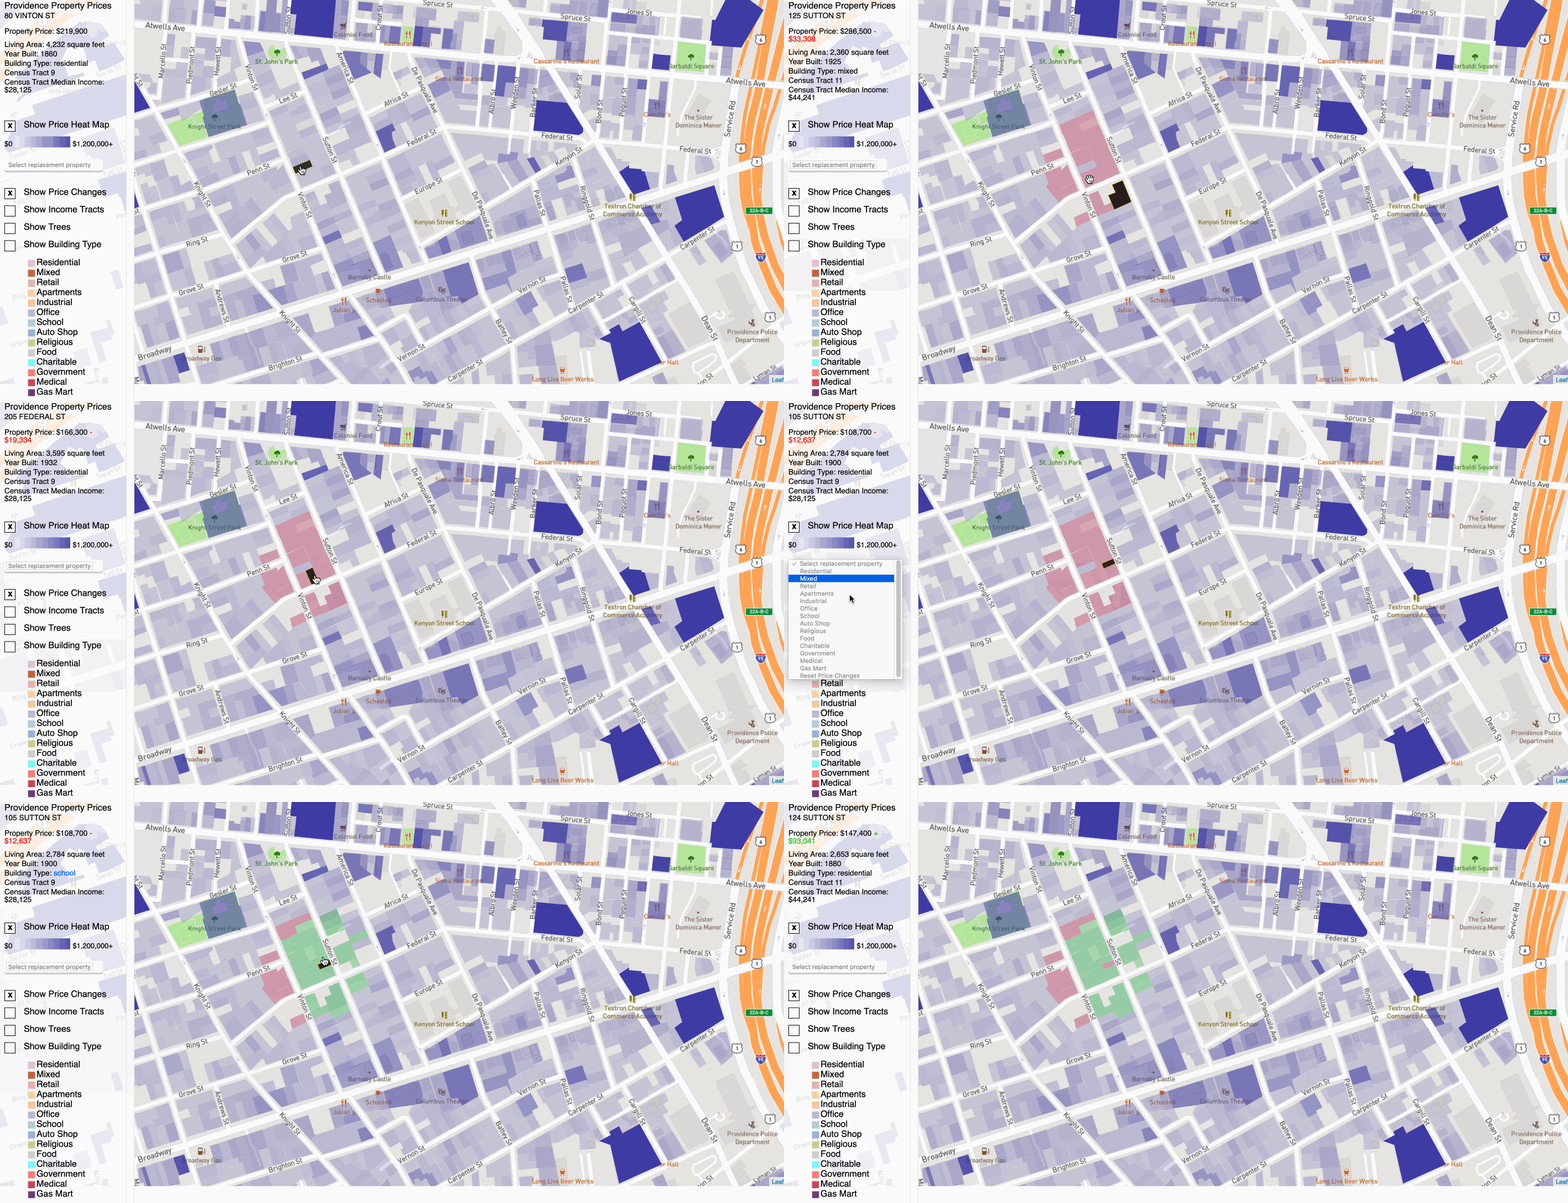
- To replace a property with another building type, first click on a property on the map. This locks the building that will be replaced (if you want to unlock, click the property again). After the building is locked, click on 'Select replacement property' and click on a building type. This will change the selected property's building type to the one just chosen. As a consequence, the closest 30 neighbors will experience price changes. These price changes will appear as red/green coloration on the map if 'Show Price Changes' is checked.
Note that if the building type in 'Select replacement property' is the same as the building type that appears in the info box, no changes will be made. Sometimes, properties that you believe are neighbors may not change, due to multiple properties being densely stacked together.
These replacements are stateful. That is, from the original clean state, sequential replacements will cause price changes to stack on top of each other and compose (see below gif). In order to restore to a clean state, click on 'Select replacement property' and click on 'Reset Price Changes'. - 'Show Income Tracts' will show census tracts shaded according to 2017 median income for that tract.
- 'Show Trees' will show trees as recorded in 2016. A species pop-up will appear if the tree is clicked.
- 'Show Building Type' will show a selected set of building types.
- Note that for the property price heat map and the property building types, some coloration appears particularly dark as a result of many properties stacked on top of each other.

The paper describing the methodology behind the computation of the price changes is presented below. Part of the data processing code used to generate the paper’s results is available here. The below PDF is also available at this link (open it in a new tab).